VMware NSX is a software-defined networking (SDN) platform that offers a centralized way to manage and control network traffic. It allows you to create virtual networks, firewalls, and other network security policies. To ensure proper operation of NSX, it is important to monitor its health and performance. This page provides guidance on monitoring and troubleshooting VMware NSX.
Using Monitoring Dashboards
You can use the built‑in monitoring tools such as the monitoring dashboard to monitor the environment, within the home screen of NSX Manager. In the NSX Manager console, there are several monitoring dashboards right here in the console itself.
Using Monitoring – System Dashboard
First, let’s look at the system monitoring dashboard.
On the left side of the dashboard, you will find statistics and monitors for the system, specifically the NSX management cluster.
On the right side, you will find information about the fabric itself, including all transport nodes, transport zones, and compute managers. If there were multiple compute managers, you would see the status for each of them.
At the bottom left, you will see the overall backup status. Automatic backups are currently disabled since this is just a lab environment, but you can still view the last completed backup time for both the node you’re currently on and the entire cluster.
Make sure that all components show a green “OK” status and not any other statuses such as “IN PROGRESS”, “DEGRADED”, “UNKNOWN”, “NOT CONFIGURED”, or “ERROR”.
Clicking on each component will provide more details about its status.

Using Monitoring – Networking & Security
The next dashboard is for monitoring networking and security.
Starting from the top left, there are 17 groups and 8 distributed firewall policies.
In the top middle, you can see the status of the Tier-0 and Tier-1 gateways. Currently, there is no Tier-1 gateway as shown in the screenshot.
In the top right, you can see the total number of segments in the environment.
Moving to the bottom panel from left to right, you can view the number of load balancers, virtual services, and VPNs.
In each of these sections, the status of the components is indicated by a color code. Green means SUCCESS, amber means IN PROGRESS, gray means UNKNOWN, dark gray means UNINITIALIZED, and red means ERROR.
Make sure these components show green. If not, click on the rings to view more information about these components.

Using Monitoring – Compliance Report
The third monitoring dashboard displays the compliance report, which identifies items that are out of compliance in the environment.
In this small environment, we have several items that are out of compliance. For example, we do not have CA-signed certificates, we are not using authentication for our BGP peers, and the FIPS global setting on our load balancer is disabled. While we are not currently using the load balancer, this is still a concern that should be addressed in a real environment.
Like the other dashboards, you can click on the affected resources in the far-right column to view which resources on which node are impacted by this compliance finding.

Using Monitoring – Custom
If you have created custom dashboards, you can view them by navigating to Monitoring and selecting Custom.

Using Alarms
In the Alarms panel, you can view the Open, and Acknowledged/Suppressed alarms.
In this below screenshot, you can see there are 11 Open alarms shown on the top left side along with Acknowledged/Suppressed alarms.
In the top middle, you can see Top Features with the Most Alarms and the top right side, you can see Top Events by Occurence.
In the bottom section, you can see all the Events along with Feature, Event Type, Entity Name, Severity (High, Critical or Medium) , Last Reported Time, and the Alarm state (Open or Resolved).

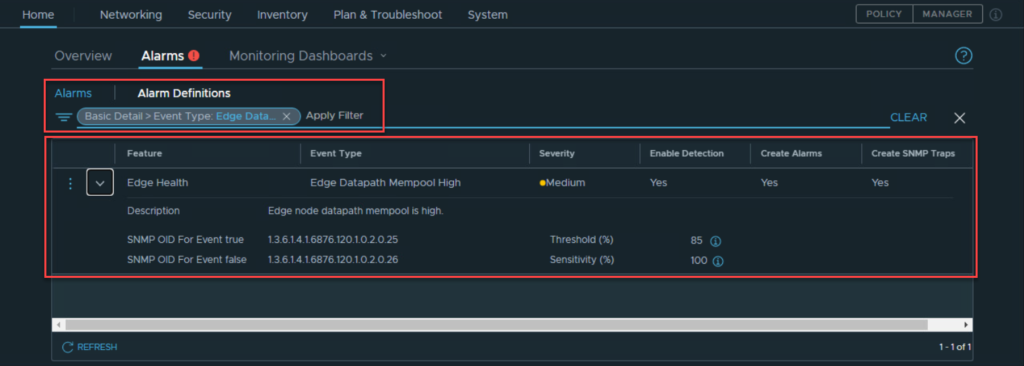
When you click on an Event Type in the list, it will provide more information about the event and it tells us what Feature, Event Type, and Severity, etc.
Also, when we expand, we get the SNMP OIDs for Event True and for Event False. You can configure SNMP traps or SNMP polling to look for those OIDs, and that gives you the OIDs for that exact entity within your environment.
By the way you can also filter the alarms.